
Garland, Texas bought about 1.75 times as much investor property in the last twelve months as it did the year before. Mesquite ran about 1.53. Wylie about 1.91.
None of those are new-construction towns. Garland is about 1% new construction with a median year built of 1976. Mesquite is 13% at a 1987 median. These are rehab markets, and they are accelerating faster than most of the places people talk about.
If you only watch where the cranes are, you miss this entirely.
All of this sits on one screen: filters across the top, property cards on the left, and a clustered map on the right that shows you where activity concentrates.
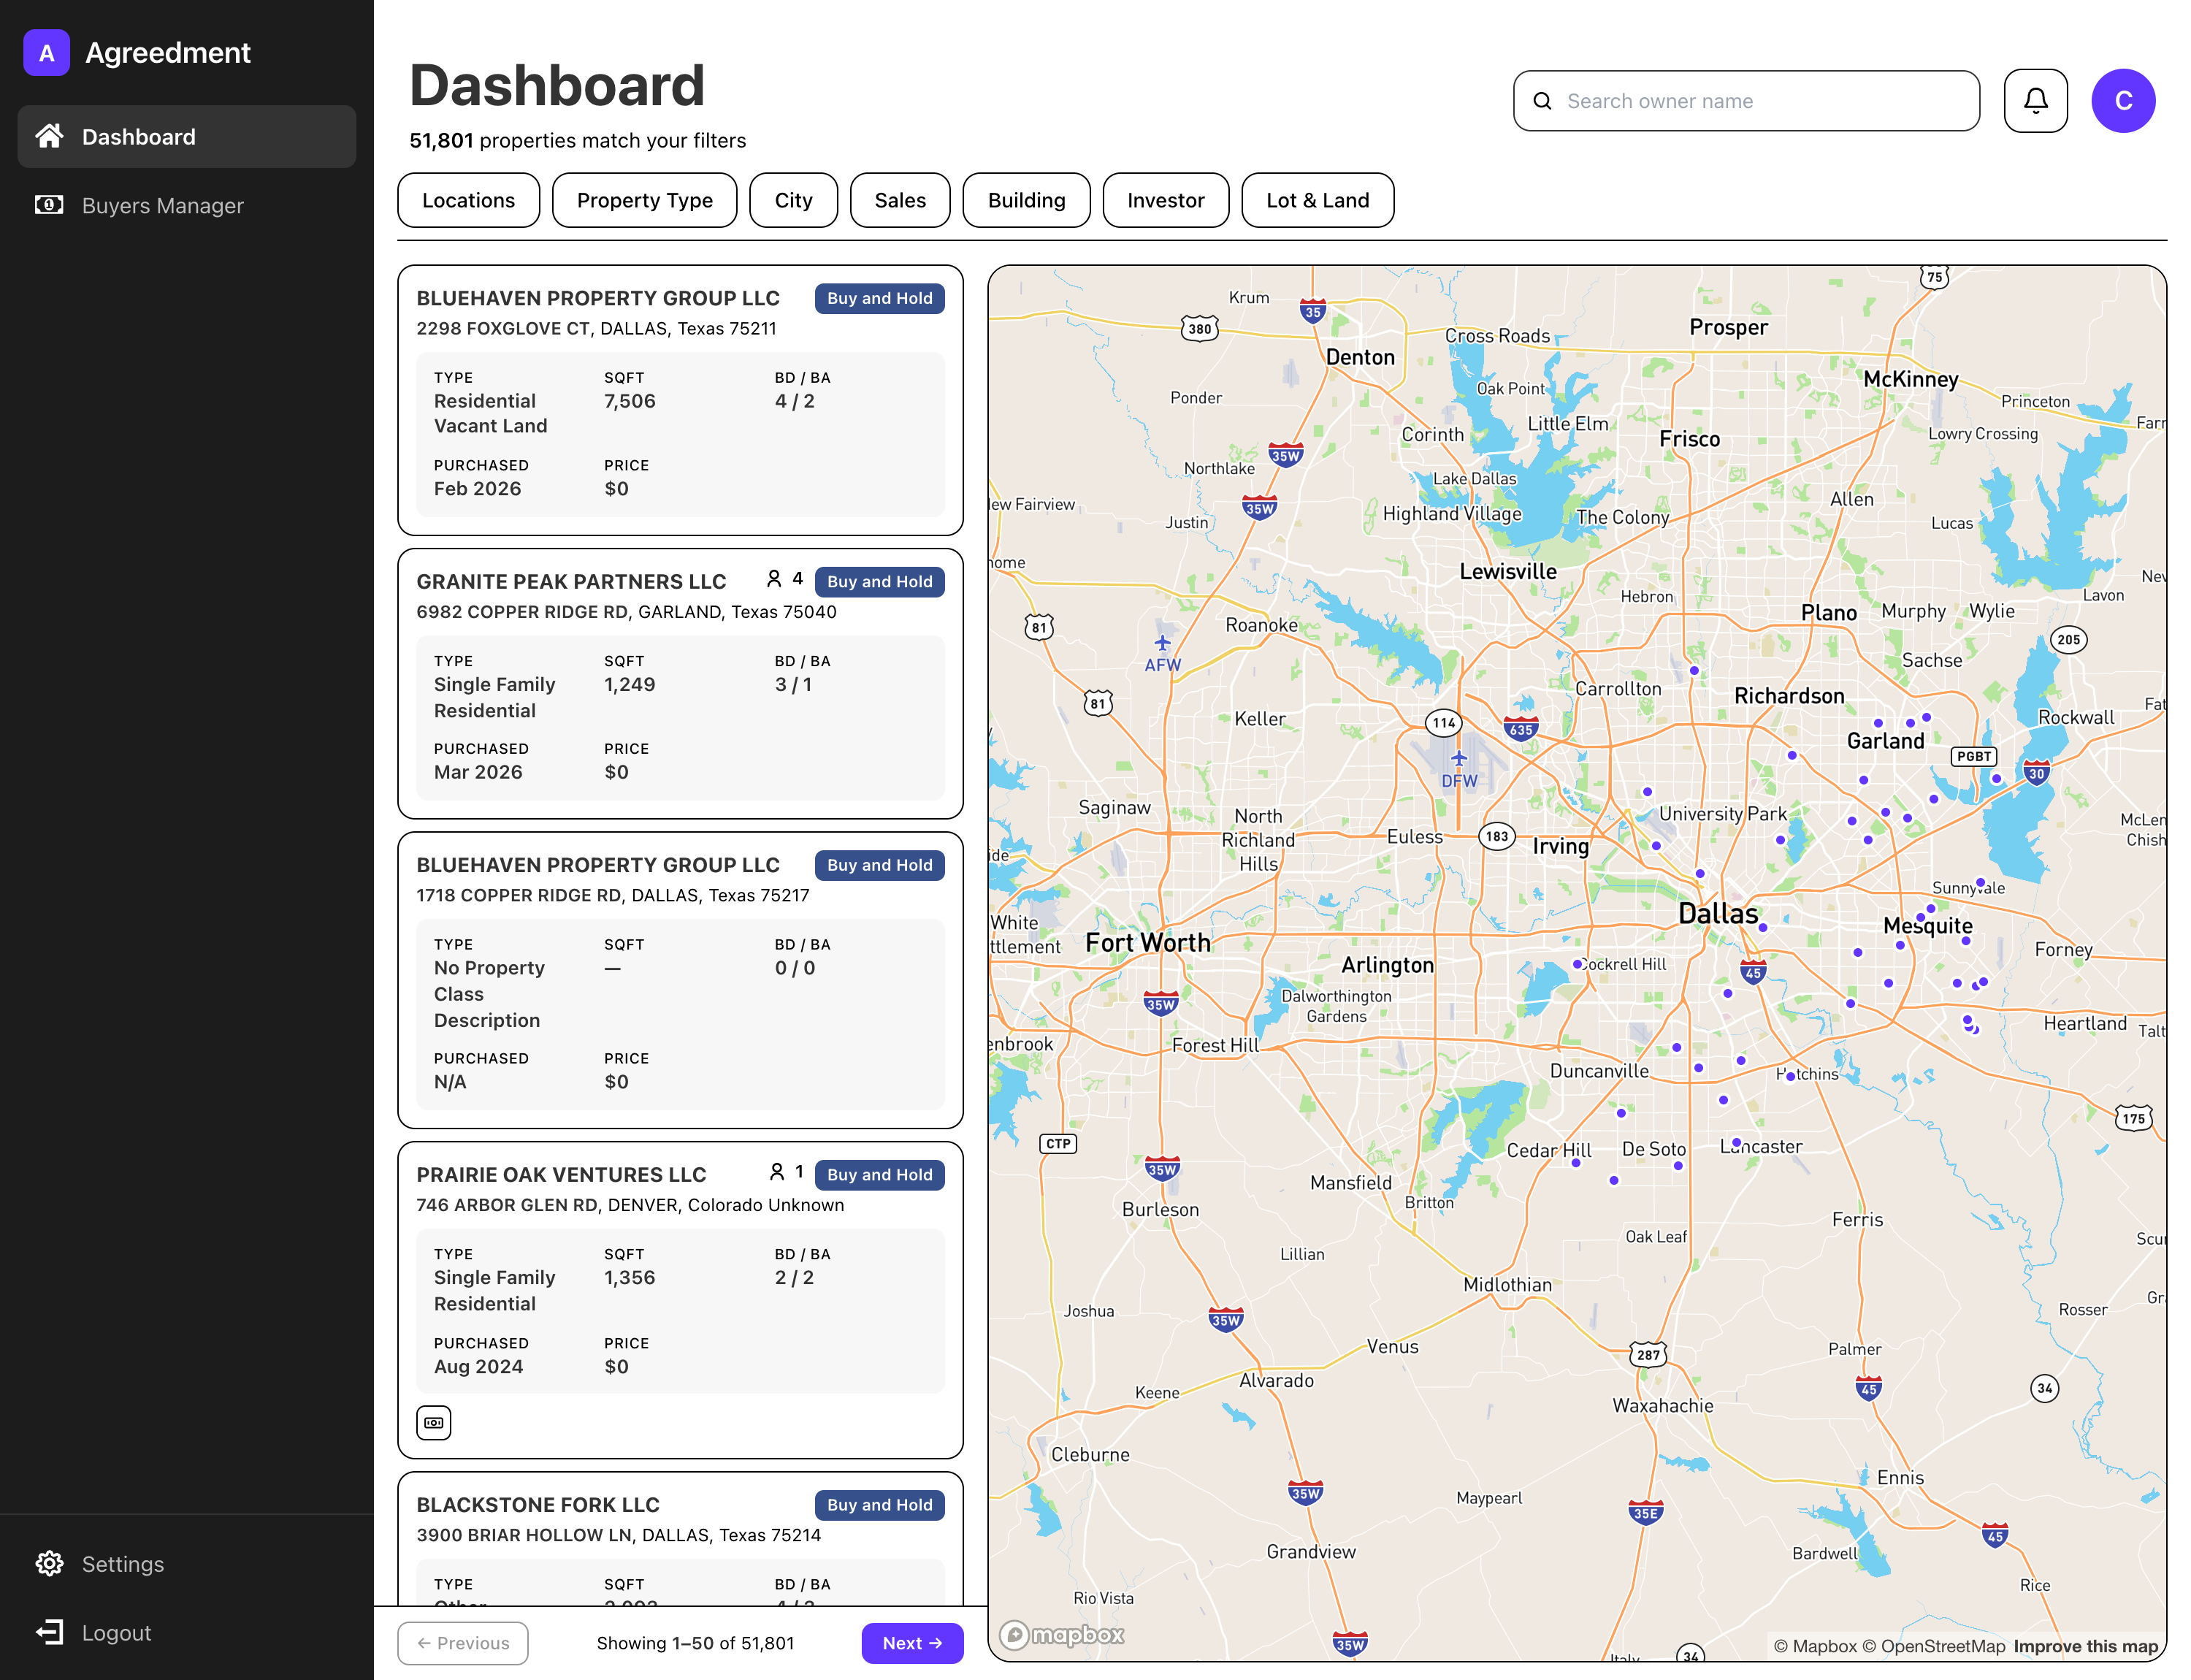 Filters on top, cards on the left, the map on the right.
Pace, and why it beats a headline count
The number here is simple: acquisitions in the last twelve months divided by acquisitions in the twelve months before.
Above 1.0, more property is being bought than a year ago. Below 1.0, less. The further from 1.0, the sharper the move.
It matters because stock measures — how many properties a market holds, how many investors are in it — change slowly and tell you about the past. Pace is the first thing to move when conditions change, and it is the number that predicts whether your next quarter of calls finds buyers who are actually writing offers.
A market can hold enormous inventory and have stopped transacting. Columbus, Ohio holds about 43,217 investor-owned properties, more than any other city we cover, with a pace ratio near 0.41. Purchases there fell to well under half the prior year.
Where DFW is accelerating
Run the ratio across the metro and the pattern is not what the skyline suggests.
Wylie leads at about 1.91 — nearly double the prior year, in a city that is about 36% new construction with a 2014 median year built.
Garland follows at about 1.75, Farmersville about 1.63, Mesquite about 1.53, Lavon about 1.29, McKinney about 1.27, Allen about 1.22, and Greensboro, North Carolina about 1.14.
Flat to slightly down: Frisco about 1.01, Princeton about 1.01, Dallas about 1.02, Celina about 0.97, Melissa about 0.91, Anna about 0.93, Plano about 0.93, Irving about 0.93, Grand Prairie about 0.92, Denton about 0.90.
Clearly falling: Little Elm about 0.64.
Notice what is mixed in there. Celina — 91% new construction, a genuine boom town — is essentially flat year over year. Garland, an old rehab market, is up 75%. The construction story and the acceleration story are not the same story.
Reading pace against turnover
Pace alone can mislead, so pair it with turnover: the share of investor-held property that changed hands in the last twelve months.
The two combine into four useful situations.
High turnover, rising pace. Farmersville: about 52% turnover, pace near 1.63. A liquid market getting more so. The most transactions available per unit of effort.
High turnover, flat pace. Celina: about 40% turnover, pace near 0.97. Busy and steady. Plenty of activity, no particular momentum.
Low turnover, rising pace. Greensboro, North Carolina: about 22% turnover, pace near 1.14. Quiet but waking up. Worth watching before it is obvious.
Low turnover, falling pace. Little Elm: about 18% turnover, pace near 0.64. Quiet and getting quieter.
The pairing is more honest than either number alone, because it separates how much is moving from whether that is changing.
Why Wylie is the interesting one
Wylie deserves a second look, because it sits in a category of its own in this metro.
About 36% new construction with a median year built of 2014 — so neither a pure building town like Lavon nor an old rehab market like Garland. It is a suburb part-way through its build-out, with a mix of newer housing and enough existing stock to support both kinds of buyer.
And its pace ratio is about 1.91, the highest in our DFW coverage, on about 36% turnover.
A mixed-age market accelerating hard is unusual, and it is the kind of place where your deal has a decent chance of fitting whatever you have. A builder can use the land, a rehabber can use the older houses, and both groups appear to be buying more than they were a year ago.
Compare that to Little Elm — median year built 2010, so a similar vintage — where turnover is about 18% and pace about 0.64. Two comparable-age suburbs moving in opposite directions, which is exactly the kind of difference that disappears if you treat "the northern suburbs" as a single market.
What a falling number is not
Worth being careful here, because this reads worse than it is.
A market where purchases fell by half is not one where investors went broke or left. They still own the property. Columbus still holds tens of thousands of investor-owned units that are still rented and still generating decisions.
What a falling count says, narrowly, is that fewer investors are actively buying right now. Some are digesting what they already acquired. Some are waiting on financing conditions. Some genuinely stopped.
You cannot tell which from this figure, and claiming otherwise would be guessing. What you can say is that if your plan requires buyers who are writing offers this quarter, there are fewer of them there than a year ago. That is a real planning input without being a verdict on anyone's business.
The same caution applies upward. A rising number is not free money — it means more competition for the same contracts, because the buyers shopping hardest are also the ones every other wholesaler is calling.
The habit
Pull both windows. Last twelve months, and twenty-four. Subtract for the prior year.
Divide. You now have direction, not just level.
Pair it with turnover. Four situations, not one ranking.
Re-check it. This is the fastest-moving number in a market profile. Stock figures drift; pace can turn inside a quarter.
None of this takes long. Two figures per city, one division, and a glance at turnover alongside it.
The cities worth your attention are rarely the ones in the headlines. They are the ones whose pace turned before anyone noticed, and that is a number you can look up rather than wait to hear about.


