
Pick a county and the investor activity inside it is never spread evenly. It clusters, usually hard, and usually in a handful of ZIP codes that look unremarkable from the outside.
Denton County, Texas is a clean example. County-wide, about 29% of investor-owned property changed hands in the last twelve months. Go down to the ZIP level and 76258 turned over 54% — roughly 489 purchases against 904 investor-held properties. One ZIP running at nearly twice the county rate.
If you farm the county evenly, you spend the same effort on blocks where investors are barely transacting as on the ones where half the investor-held stock moved in a year.
Finding the breakdown is the easy part. In Agreedment, the Locations panel holds a state, county and ZIP tree under one search box, so you can walk from a state down to the individual ZIPs inside a county without leaving the filter.
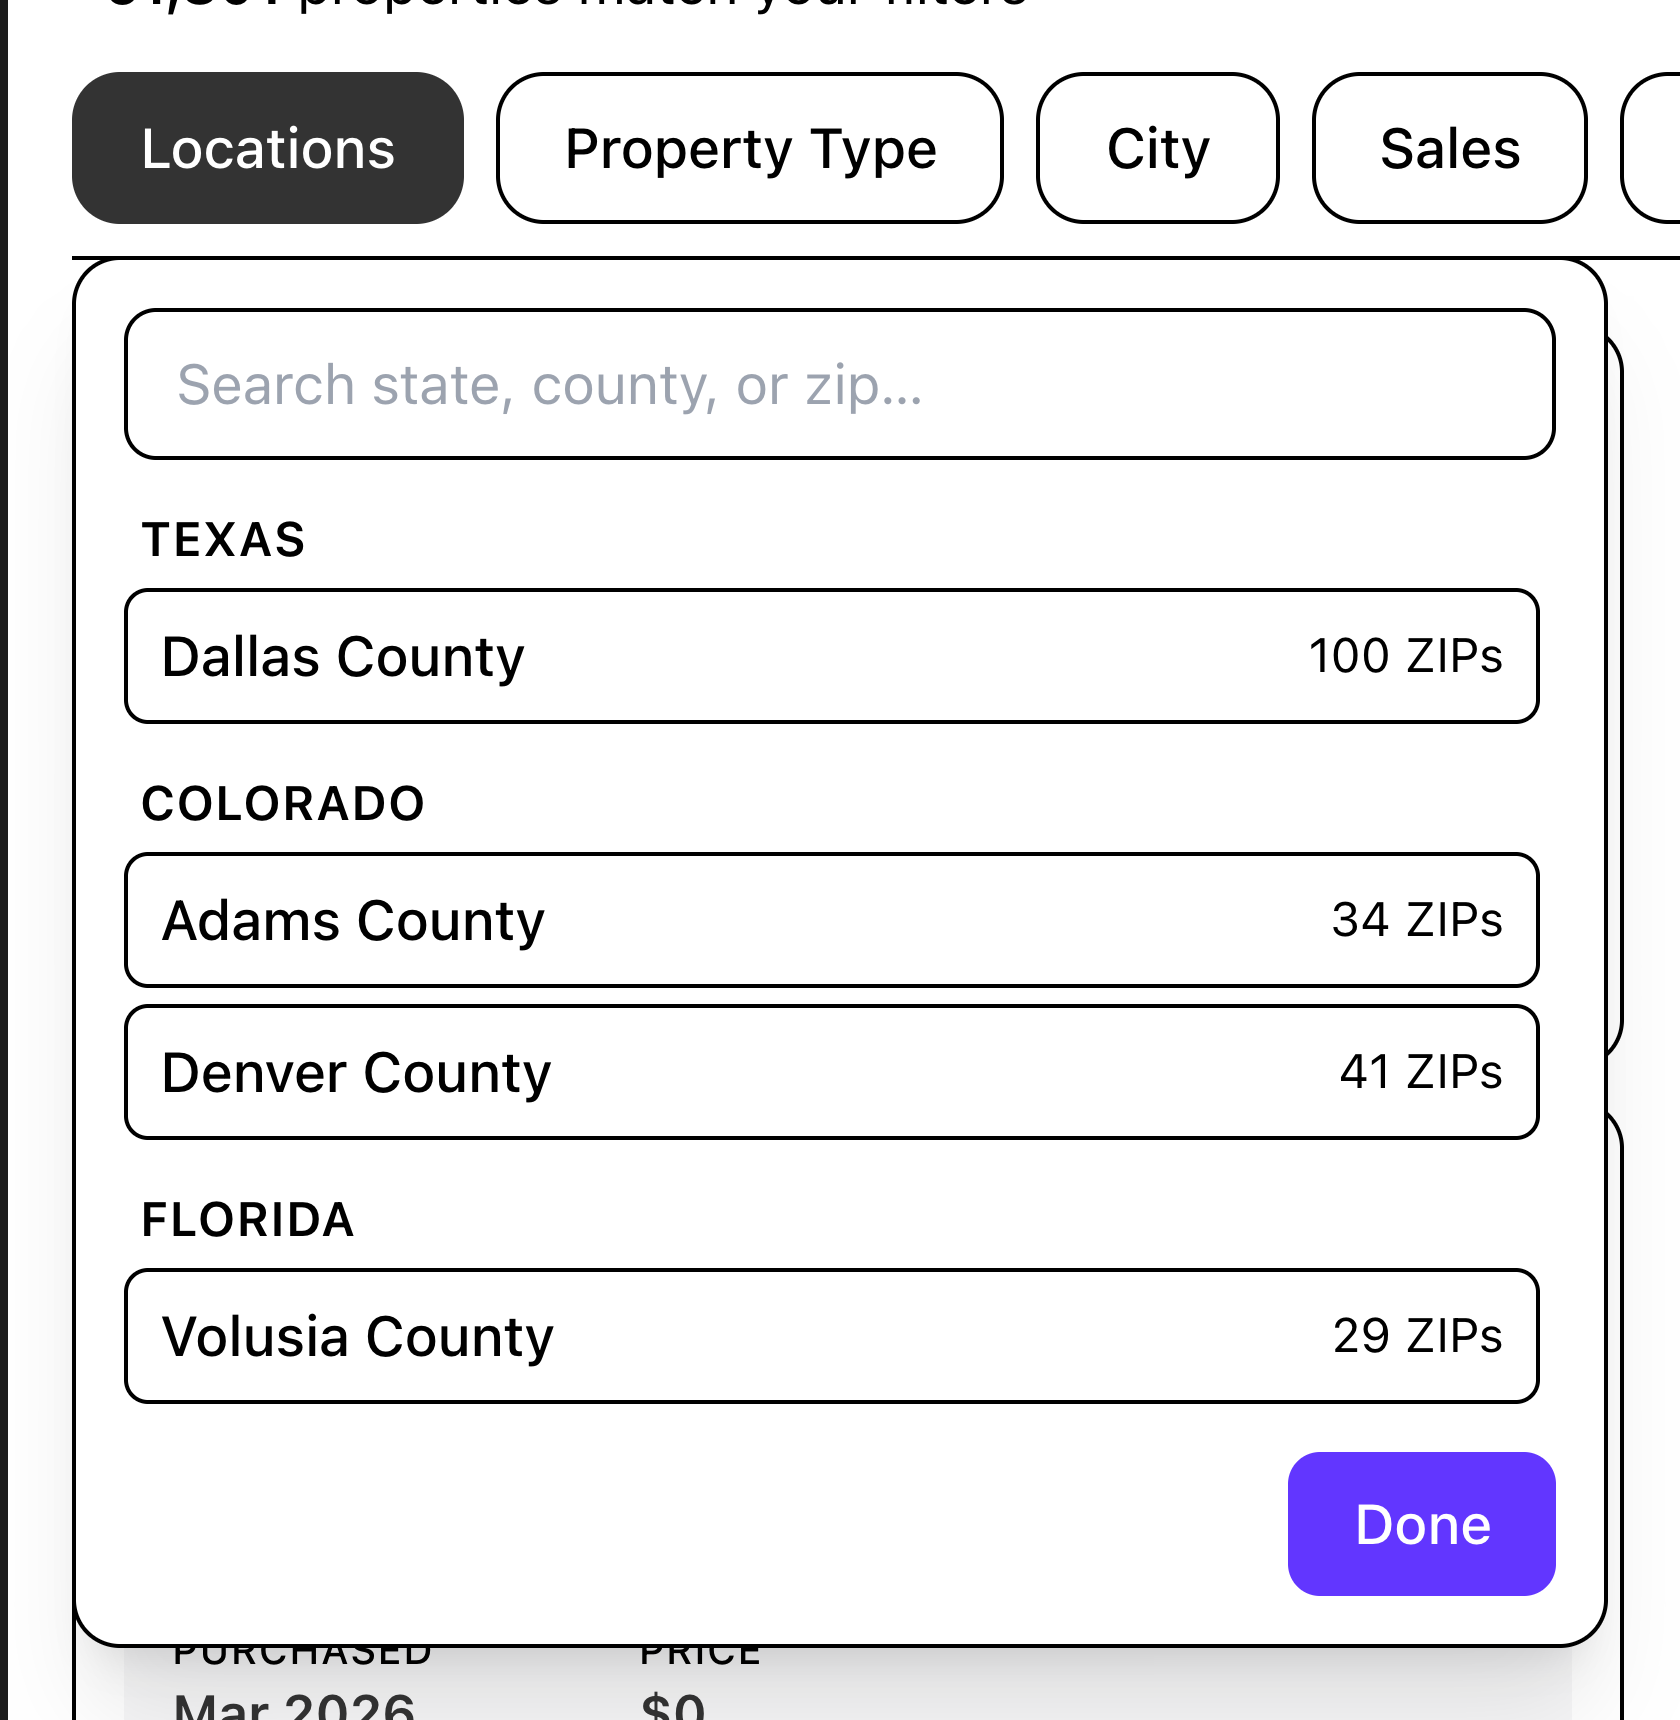 A state, county and ZIP tree under one search box.
What "hottest ZIP" should actually mean
The instinct is to rank ZIPs by raw purchase count, and that is the wrong instinct. A big ZIP will always show more transactions than a small one. All you have measured is size.
The number that means something is turnover: purchases in the last twelve months divided by investor-held properties in that ZIP. It answers a different question — not "where is there a lot of investor property" but "where is investor property actually changing hands."
Denton County's top three make the distinction visible.
76207 — about 605 purchases against 1,339 investor-held properties. Highest raw count in the county, 45% turnover.
76258 — about 489 purchases against 904 properties. Fewer transactions, but 54% turnover. The highest rate.
76227 — about 375 purchases against 1,316 properties. 28% turnover, close to the county average.
Rank those by count and 76207 wins. Rank by turnover and 76258 does. The second ranking is the one that tells you where a seller lead is most likely to have a buyer waiting.
Notice also that 76227 holds nearly as much investor property as 76207 but trades at little more than half the rate. Same apparent opportunity on a stock measure, very different behavior.
The same pattern, a different market
Durham County, North Carolina shows this more sharply, because it is the fastest-accelerating market we cover.
27703 — about 551 purchases against 1,125 properties. 49% turnover.
27704 — about 267 purchases against 459 properties. 58% turnover.
27705 — about 150 purchases against 237 properties. 63% turnover.
Here the ranking inverts almost perfectly. The ZIP with the fewest transactions has the highest turnover rate, and the one with the most has the lowest. A count-based list would put them in exactly the wrong order for a wholesaler deciding where to spend a week.
What 63% turnover in 27705 actually describes: of the investor-held property in that ZIP, nearly two-thirds changed hands within twelve months. That is a small, fast-moving pocket. Properties there are not sitting in portfolios for years.
What the number does not tell you
Three honest limits, because this metric is easy to push too far.
Small denominators exaggerate. 27705 has about 237 investor-held properties. At that size, a few dozen transactions swing the percentage hard. A high rate on a small base is a real signal but a fragile one — check whether the ZIP is big enough for the number to be stable before you reorganize around it.
Turnover does not say who is buying. A ZIP can turn over quickly because one institutional buyer assembled a position, or because thirty small operators were trading. Those are completely different outreach problems and the rate alone cannot separate them.
It is backward-looking. Twelve months of completed purchases describes what happened, not what is happening. In a market that has turned recently, the trailing number lags the reality.
None of that makes it less useful. It makes it a starting filter rather than a conclusion — the thing that tells you which three ZIPs to look at properly, not which one to commit to.
Two things that will corrupt the ranking
Worth knowing before you build a list off this, because both show up in real data and both produce nonsense quietly.
Extended ZIP codes. Some records carry the full nine-digit form — a ZIP+4 like 80205-5484 rather than 80205. A ZIP+4 covers a block face, sometimes a single building, so it may hold a handful of properties. Rank by turnover without noticing and these sort straight to the top at or near 100%, because every property in a two-property segment trading once is 100% turnover. They are not hot markets. They are tiny denominators wearing the same unit as a real ZIP. Collapse them to five digits or exclude them.
Unattributed rows. Some transactions arrive without a usable ZIP and get grouped under an unknown bucket. That bucket can look substantial — hundreds of properties — but it is not a place. It is a filing problem, and it cannot be farmed. Drop it rather than letting it occupy a slot in your top three.
Both are easy to catch once you know to look: scan the denominators before you trust the rates, and treat any ZIP that is not exactly five digits as suspect.
One interface detail worth knowing while you do this. Expanding a county to see its ZIP list is a look, not a filter — the numbers on screen still describe the county until you actually select something.
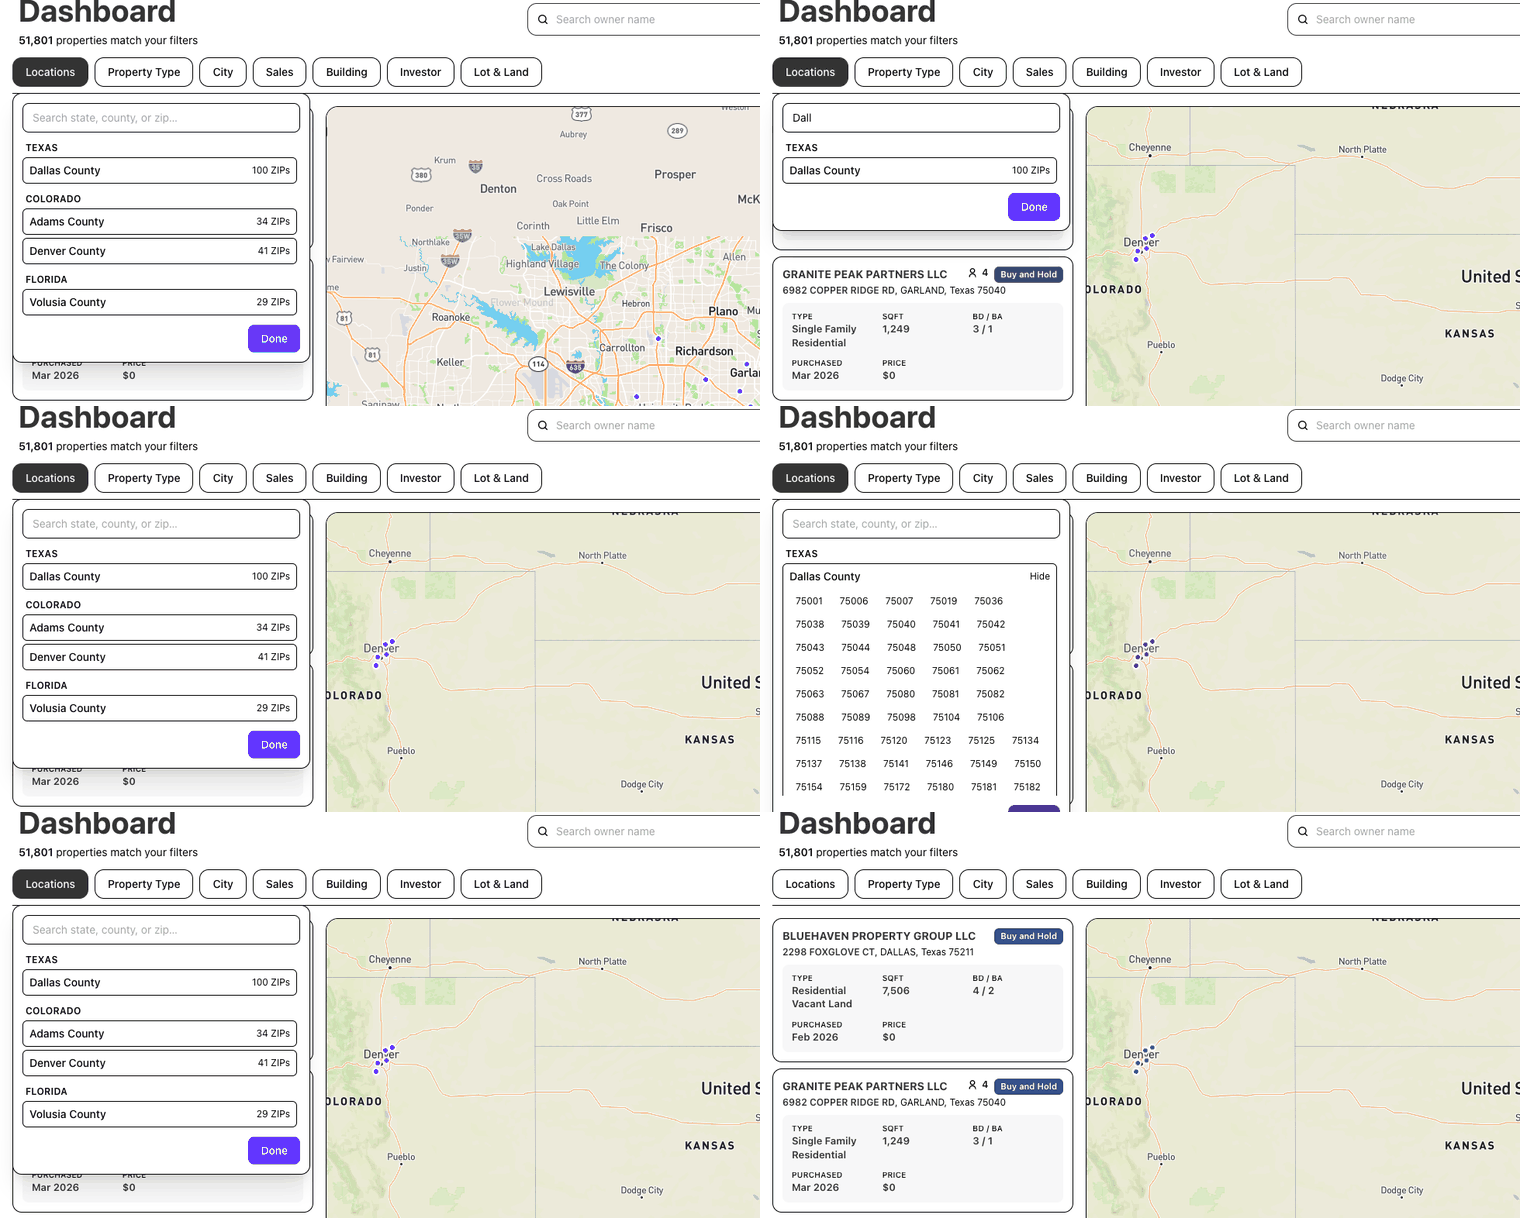 Expanding ZIPs only looks; it does not filter.
It is an easy misread: you expand a county, see the ZIPs, and assume the counts beside your results have narrowed with them. Select the ZIP you want before you read anything off the screen.
Using it on a seller lead
The practical application is smaller than market selection and more immediate.
You have a lead. Before you work out what it is worth, check the turnover rate in its ZIP. In a ZIP running near 50%, investor demand for that kind of property is demonstrably active — buyers there have been closing. In a ZIP running near 10%, you are not necessarily out of luck, but you should expect to work harder to find the buyer, and you should price the deal knowing that.
Once a ZIP is scoped, the results give you the same answer two ways: a card for every property on the left, and a clustered map on the right. The clusters are the fast read — they show you whether activity in that ZIP is spread evenly or packed onto a few blocks, which a turnover percentage alone will never tell you.
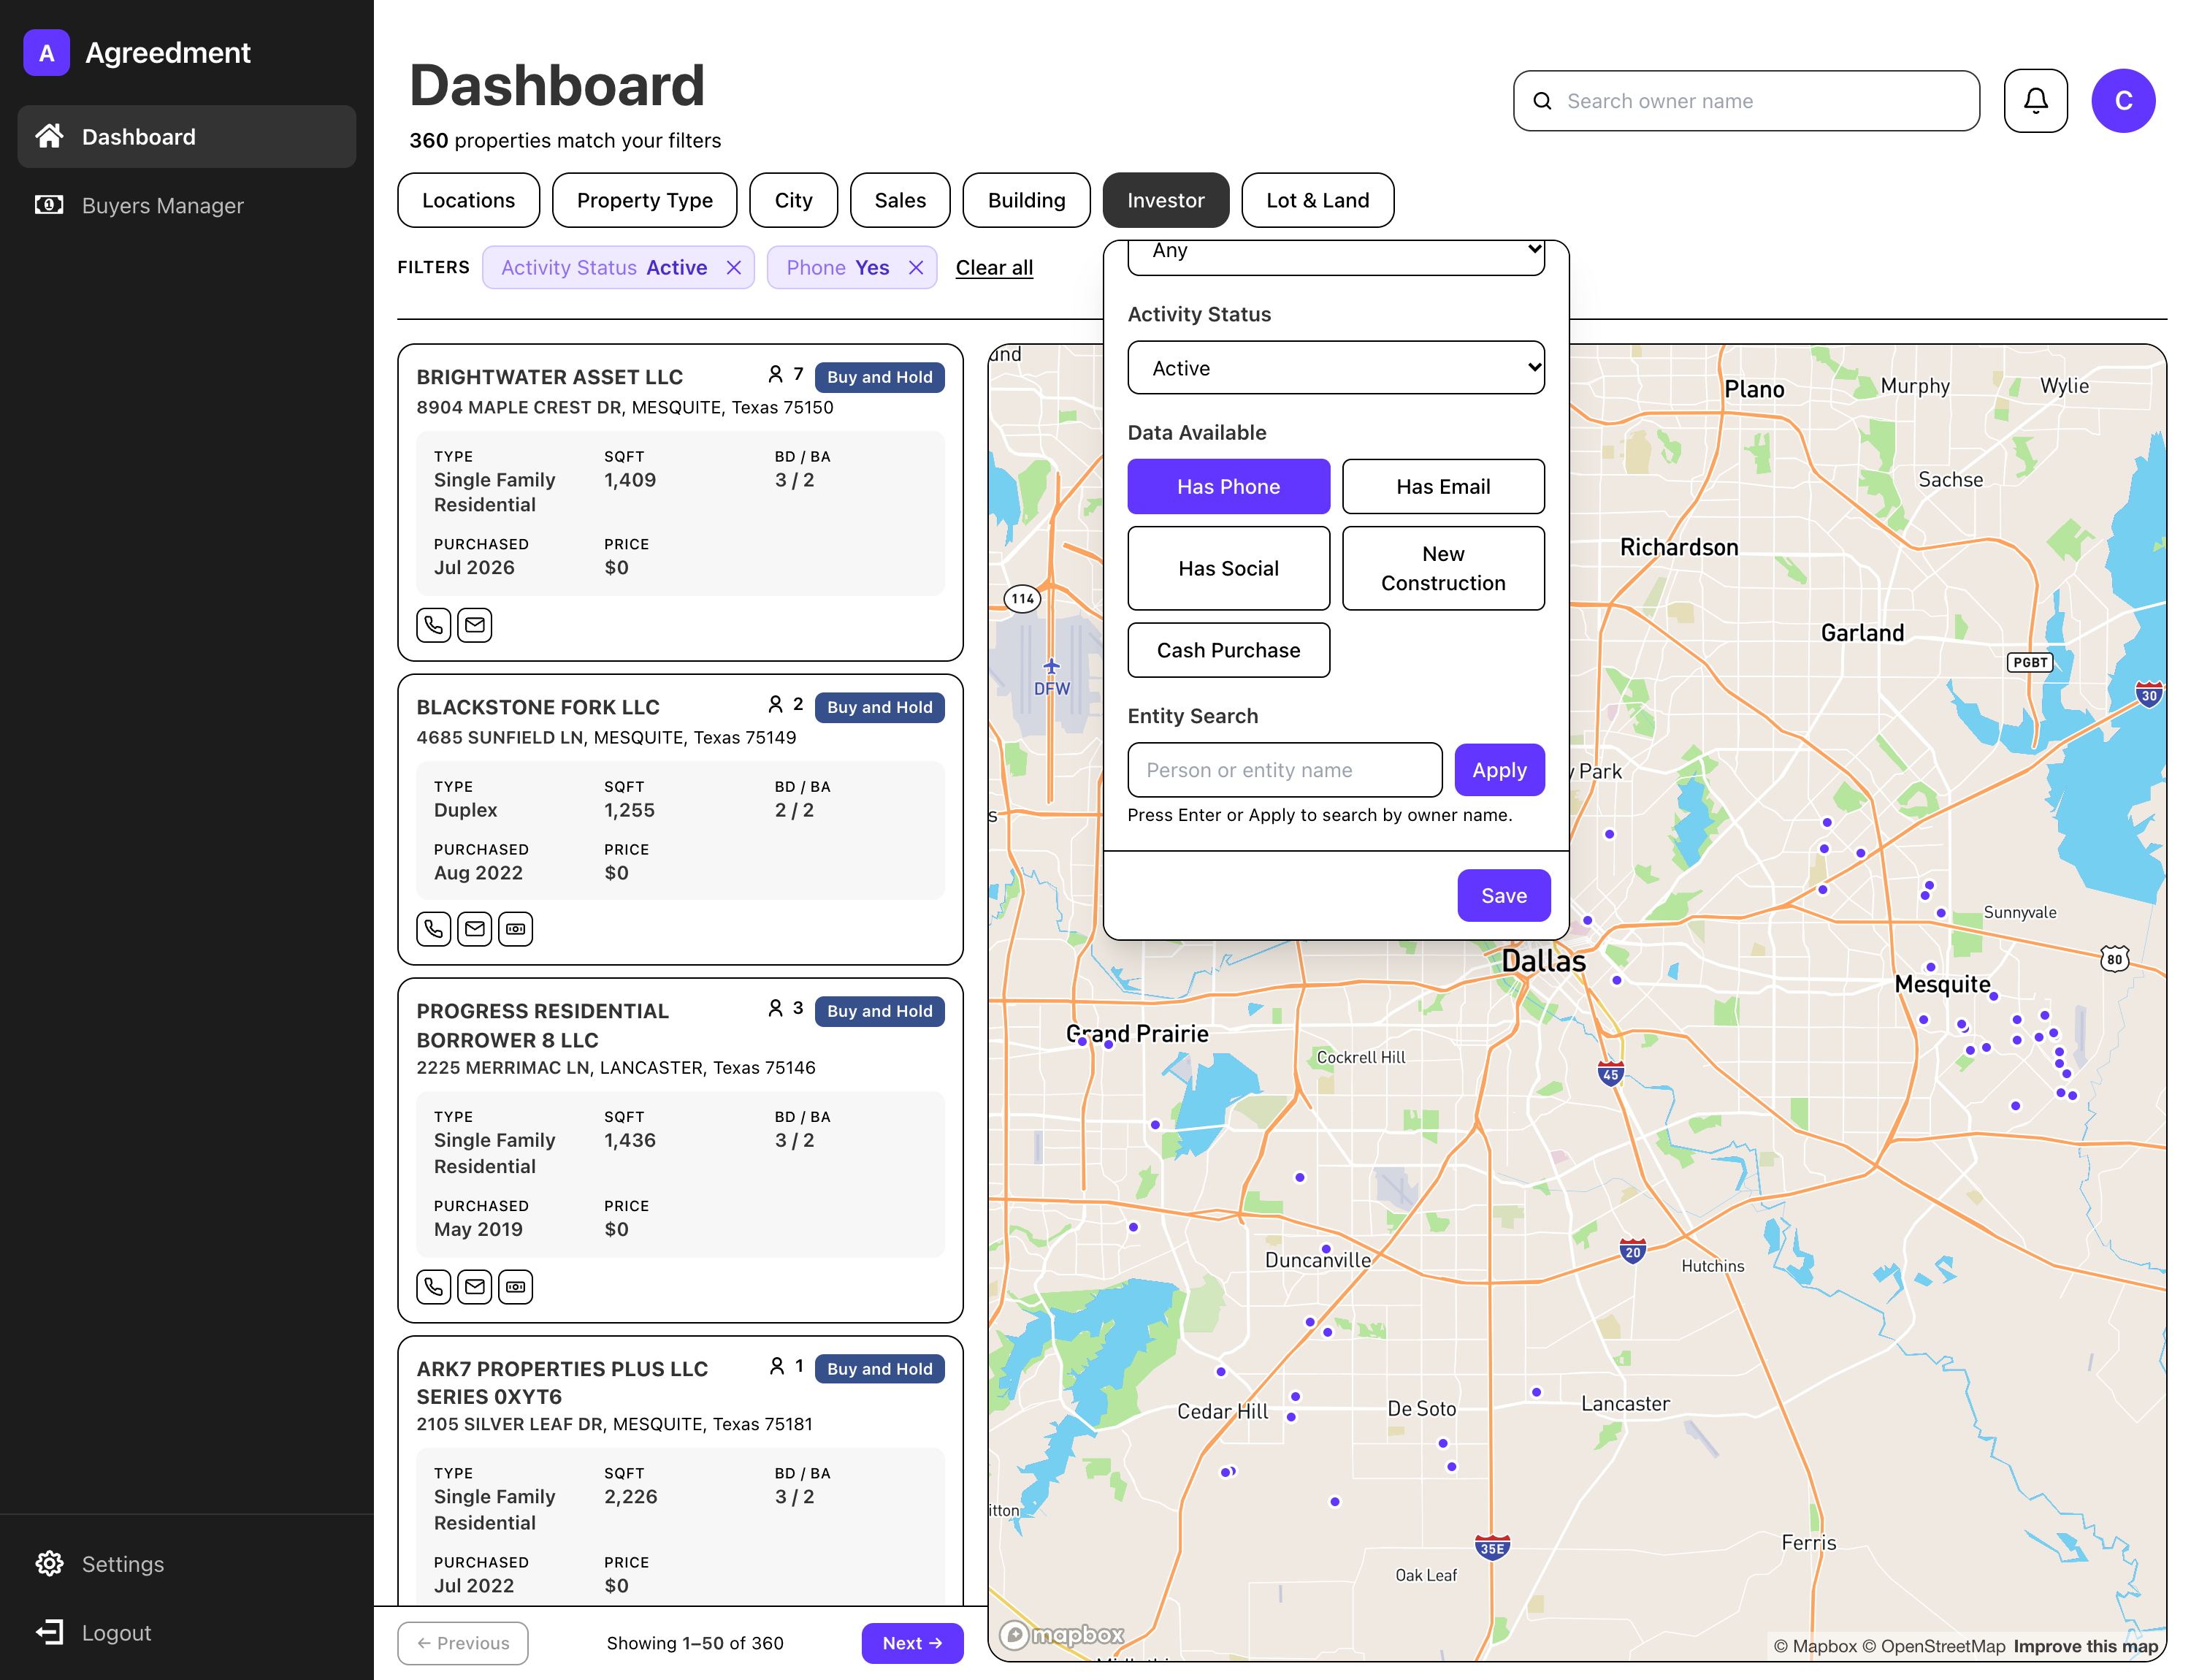 Cards and clusters update together.
It also tells you where to farm. If you are choosing between two areas and one shows investors trading half their held property a year while the other shows a tenth, the first is where your marketing is most likely to meet demand that already exists.
The habit
Three steps, and none of them take long:
Pull the ZIP breakdown for your county, not just the county total. The county figure is an average of very different places.
Rank by turnover, not count. Purchases over investor-held properties. Count ranks by size; turnover ranks by motion.
Sanity-check the denominator. A 60% rate on 200 properties and a 45% rate on 1,300 are not the same quality of evidence, even though the first number is bigger.
County-level data tells you whether a market is worth entering. ZIP-level data tells you where inside it to actually spend your week. Most people stop at the first one, which is why so much farming effort lands on blocks where nothing is moving.


